Email on Acid Analytics is a powerful tool that can help you learn more about your subscribers. This guide will show you how to get up and running with EOA Analytics. If you have any questions, don’t hesitate to reach out to the EOA support team.
What’s a Tracking Code?
In order to generate your stats, you need to include our tracking code in your email. When your email is viewed by your subscribers, this tracking code will load an image from our servers. This enables us to discern what email client the recipient was using, and how they interacted with your email (printing, forwarding, deleting, and so on).
Getting Started
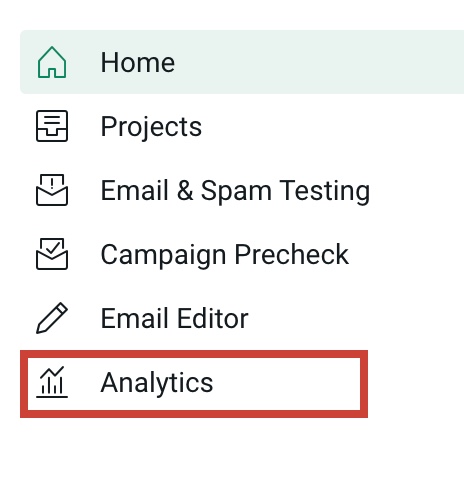
To get started with your first campaign, click Analytics from the left sidebar, which displays a graph icon.
To view existing campaigns, you can filter your Projects page to show only Analytics Campaigns.

Creating a Campaign
1. Details
First, you’ll need to fill in the basic details of your campaign:
Campaign Name: Name your campaign with something unique so that you can reference it easily later.
Tags: Tag your campaign for easy filtering in your Inbox at any time.
Total Subscribers: This number will determine how your percentages are displayed in your Campaign Summary, as it is considered the number to reach “100% Opens”. If you do not know your Total Subscribers immediately, this can be changed at any time during the Test or Active modes of your campaign so that you can maintain accuracy.
2. Engagement Tracking
Your Timezone: Set your timezone to accurately gauge when your email was read and when it was sent out. You can also update your settings for timezones by clicking on your name in the top right, followed by “Email Test Settings” and the “Analytics Account Settings” tab.
Engagement Time Thresholds:
The three threshold settings of “Read“, “Skim“, and “Delete” will help determine how long readers were engaged with your campaign.
Read: This threshold is the maximum amount of time that we will track engagement. Any amount of time over the skim threshold will be considered “read,” but you can continue to track engagement after the skim threshold is reached. The read threshold can be set from a maximum of 30 seconds or to a minimum of one second more than the skim threshold.
Skim: This threshold should represent subscribers who glanced at the email but didn’t keep it open long enough to read the whole thing. The default setting for the skim threshold is 8 seconds, but can be adjusted to your needs easily.
Delete: This threshold should represent readers who opened the email just long enough to delete it. Sometimes subscribers will see an unwanted email and delete it without opening it, but many other users open all emails in sequence and delete or read them as they go. Mobile users also often find it easier to open a message and then delete it. Because of this we include a low threshold, below which emails are considered not to have been read at all. The default setting for the delete threshold is 2 seconds.
Note: We recommend that you use consistent read, skim and delete thresholds on each of your analytic campaigns. This will allow you to compare your average engagement across multiple campaigns over time. You can set the defaults for this in your user settings (Settings/Analytics) and save them.
3. Subscriber Tracking (Optional)
For the most detailed reporting on your email campaigns, we recommend that you use Merge Tags; these are designated by your email sending service and are unique to their service. Our Merge Tag drop-down list offers a wide variety of sending services to choose from; if you do not see your sending service on the list but think it should be, please contact helpdesk@emailonacid.com so that our friendly Support Team can provide assistance.
If you do not see your sending service listed but are familiar with your email address Merge Tag, select “Custom” and paste in the correct tag in the field provided. Some examples of email address merge tags are: [[email]], $EMAIL_ADDRESS_$, %EMAIL%.
Without a Merge Tag your reporting may not display opens as accurately as possible due to an inability to identify individual subscribers easily. To find out more about Merge Tags and ways to incorporate them, head over to our blog post to find out more.
Note: When using our Email Analytics, we highly recommend selecting a merge tag for the most accurate results. Without a merge tag, we cannot track unique ID’s for subscribers and instead rely on the IP address. This can result in unique customers being identified as one customer because they are on the same IP address.
4. Click Tracking (Optional)
We can track which of your links are clicked and how many times if you select this option. To do so, we will include a query string with each link. Our system automatically modifies your links to enable click tracking, all you have to do is paste your HTML into the start form. If you are using Google Analytics, make sure to select the second option displayed after your HTML input, titled “Would you like to add Google Analytics?”
If you modify the HTML of your email after this step, you’ll need to go back into your campaign, go to settings, and complete this step (Click Tracking) again.
5. Benchmarking Diagnostics (Optional)
Checking in this box will open up a short list of questions. These questions won’t affect your email; they just make it easier to review the differences between email campaigns at a glance.
For example, you might compare your last 6 monthly newsletters and find that June was your best month by far. Checking your benchmarking diagnostics, you see that June was the only monthly newsletter that included an incentive offer. When you look at click tracking for the June newsletter, you also notice that the incentive link had excellent click through rates. You can conclude that the incentive offer had a powerful effect on your campaign, with stats to back it up.
We strongly recommend that you record this information for each campaign, as you may find it surprisingly hard to remember the details of the newsletter you sent out 6 months ago. Being able to easily reference when you started including a link to the web version of your email or optimizing for mobile devices helps make sense of the data that analytics can deliver.
6. Click “Create Tracking Code”
This should take you to a page with a tracking code. Because your campaign hasn’t been activated yet, you can test this code by adding it to your email (we recommend that you place it just above the closing body tag) and sending a few test messages. You’ll see data begin to appear in your campaign. When you’re ready to send out the real email blast, make sure to activate your campaign first.
Activating Your Campaign
Once you click the green “Activate Campaign” button at the top right of the content area. This will take you to the Activation page, where you can choose your “Scheduled completion date”.
Campaigns must be 30 days or more in length, and cannot exceed 2 years in length. If your campaign is expected to exceed 2 years, you can update your Run Dates while the campaign is active.
After selecting your Completion Date, click the green “Activate” button to activate your campaign.
Note: If your campaign exceeds 500 opens during Test Mode, your campaign will activate automatically on your behalf.
Collecting your Statistics
Once you send your campaign you’ll begin to see your stats appear within Email on Acid. It may take a little while from the time your subscriber opens the email before your graphs and data update inside your report.
If only a few people have opened your email, the data is likely to be quite skewed. Therefore, allow a little time for your recipients to begin opening your message before you try to interpret your Email Analytics stats. It is also very common to see differences in the data that we collect vs. your ESP. Click here for an article for more information on that.