Industry News
Email Engagement Metrics: More than Your Typical Analytics
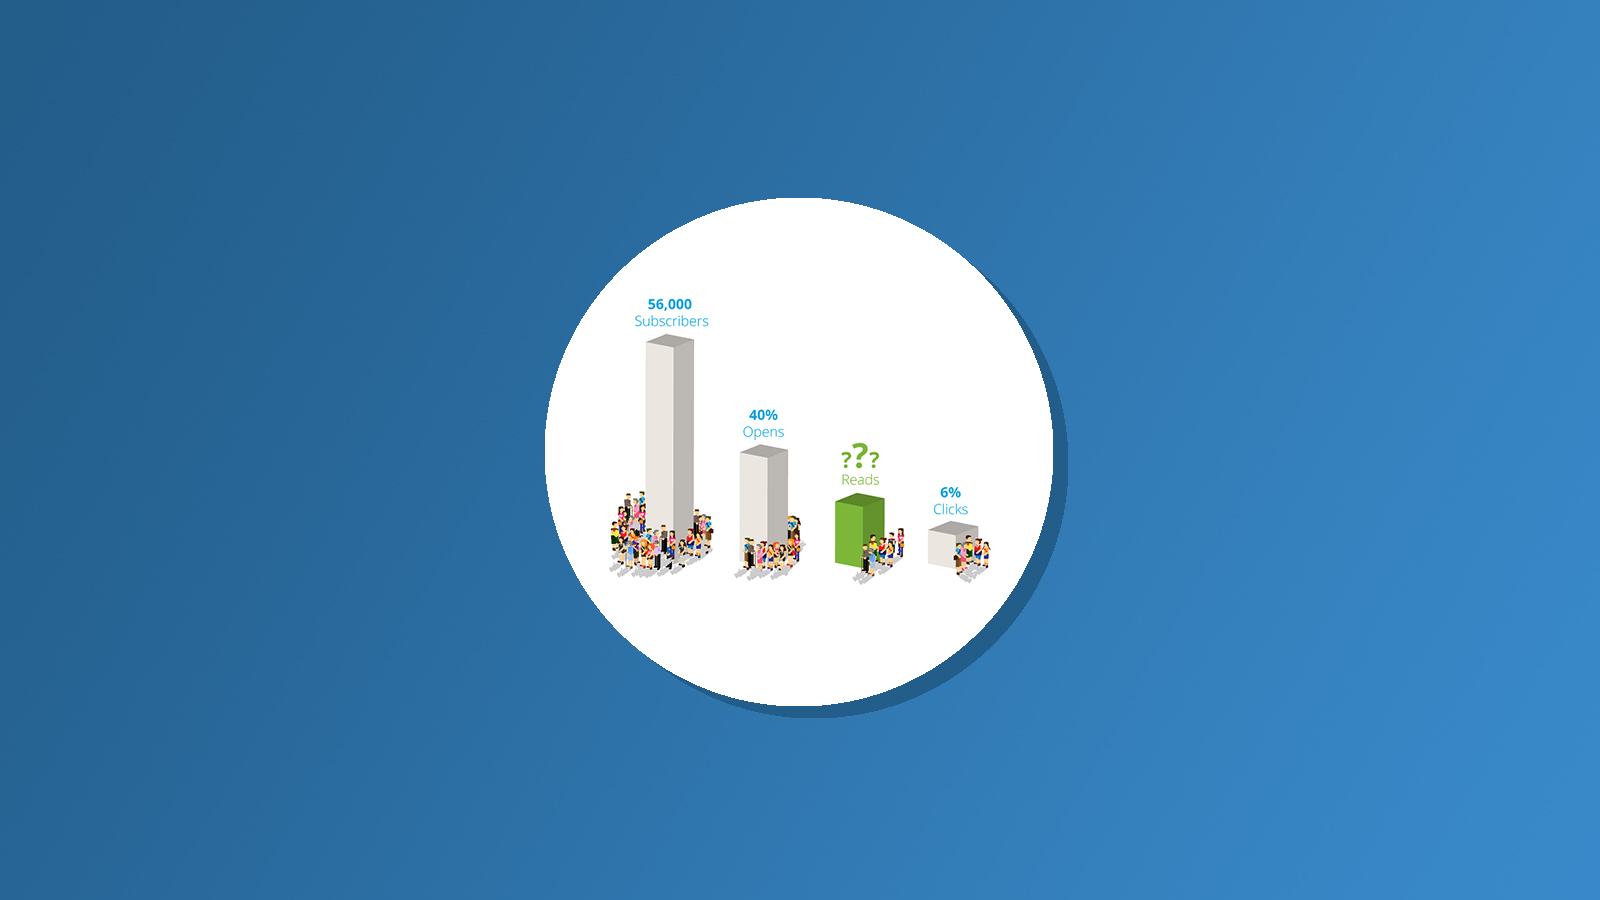
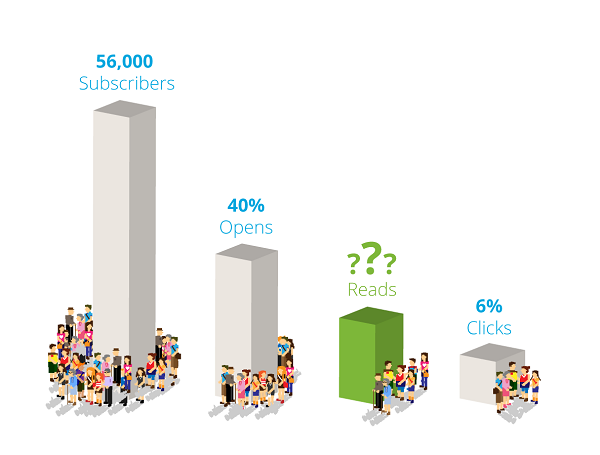
Open rates are the tip of the iceberg.
As marketers, our main goal is to find the appropriate metrics to measure our efforts. Lately, marketing aficionados have been throwing around the term “engagement metrics.” This term is popping up all around the web, but it has been extremely hard to define and especially to ascertain if you only look at each campaign or customer as an island onto itself.
Opens, CTR, conversion rate… we have all been on the merry-go-round of interpreting that data. While those metrics are a necessity and shed light on our audience’s motivation, we can still look deeper into customer behavior to calculate the engagement and effectiveness of our campaigns. We decided to look beyond our basic metrics and are defining “email engagement” by measuring what happens between an open and a click.
We put 8 of our very own marketing campaigns under the microscope to see what takes someone from an open to a click. So what data did we track to uncover this elusive metric? It’s all about the read, skim and glance rates, baby!
One powerful feature of our analytics software is that it can track how long a subscriber has an email open. This offers a lot of context to open rates, because email users often open an email just to hit the delete key shortly after. We would count an interaction like that as a “glance.” Our standard “thresholds” are as follows:
- Glance/Delete Rate – Email open for 2 seconds or less
- Skim Rate – Email open for 3 to 7 seconds
- Read Rate – Email open for 8 seconds or more
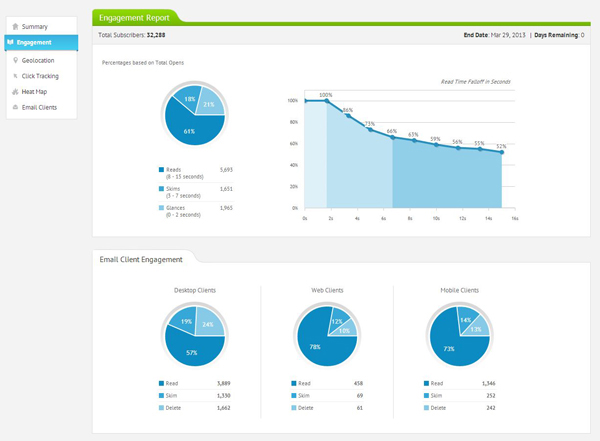
Take a peek at what our sample engagement report looks like to get a good visual.
So, what good does it do you to know how many recipients really read your email? In this three part series we are going to examine the engagement rates from 8 of our own campaigns to see what customer engagement with our brand really looks like and how we can use that information to our advantage.
Want to skip ahead? Check out the other two parts of this series in a jiffy:
- Email Engagement Metrics: Elements that Create a Killer Campaign
- Email Engagement Metrics: Applying What We’ve Learned
Reading environment: The days of desktop aren’t over.
Newsflash everyone, desktop isn’t dead! The overall trend towards opening email on mobile devices is undeniable, but our stats are telling a different story. From the 8 campaigns we analyzed, we compiled the average email open rates across web, mobile and desktop. Check out the data below from our advanced analytics to see where our subscribers read our messages:
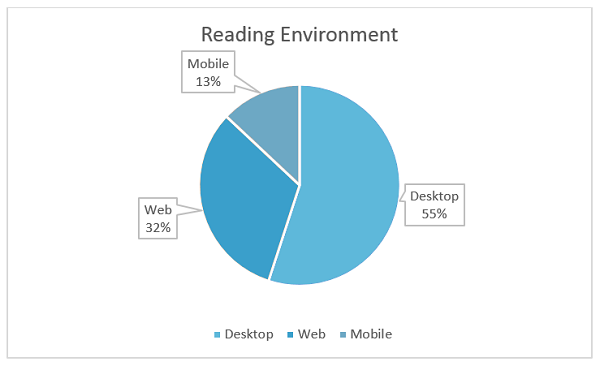
Initially, we were taken aback when we saw that not only was mobile last, but that over half of our opens occurred on desktop clients. After we picked our jaws up off the floor, we were able to deduce that since we have a B2B subscriber list, most of our emails are being opened in office settings, where desktop clients are more often utilized. We deployed our email campaigns during business hours, so most recipients were probably in the office when our mailings trickled in. B2B subscribers are often more stationary than subscribers in a B2C list.
A word of caution, though: it would not be wise to conclude that our mobile readers shouldn’t matter to us. On the contrary! Every industry average is different, but lately marketers have been seeing almost 50% of opens occurring on mobile devices. Responsive design is not a luxury; it’s a necessity. Even though only a fraction of opens are occurring on mobile, we don’t want 13% of our viewers thinking our email looks crappy. Though some industries are seeing 70% of email opens happening on mobile devices, every audience consumes email differently and we can be proud that our crowd dances to the beat of their own drum… or desktop!
What email client makes our audience tick – desktop, web or mobile?
Now that we have dissected the platforms our audience reads emails on, we wanted to figure out if those platforms affected how subscribers interacted with our emails. Opens are just the beginning of the email experience.
Take a look for yourself to see which platform garnered the most engagement after opening:
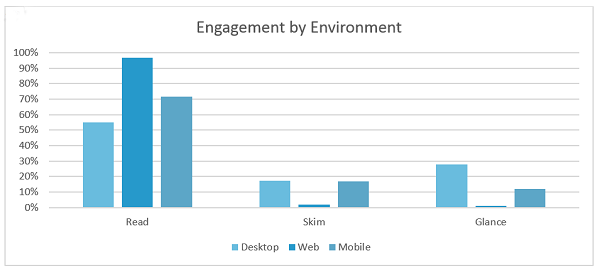
From the analytics pulled from 8 email campaigns, this graph is representative of the average read, skim and glance rate by platform.
If you are more of a numbers person, below are the exact percentages:
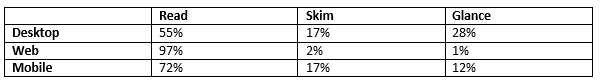
In our “reading environment” graph mentioned previously, we saw that our users prefer opening their email on their desktop clients. However, when it comes to actually interacting with our email (keeping their eyeballs on our emails for at least 8 seconds), desktop comes in last at 55%.
Overall, though, we were thrilled with the read, skim and glance rates because the majority of subscribers that opened took the time to read our content for 8 seconds or more! You might be saying, “8 seconds, that’s not long at all!” Au contraire, friend. With millions of pieces of content created each minute, our attention spans are not what they used to be. According to Statistic Brain, the average attention span in 2013 is 8 seconds. 8 seconds, guys! In the age of infobesity, compelling content is one of the major factors we are focusing on to stand out from the white noise and achieve our goal of engaging our audience.
We also love to see low glance rates. Even if they did not take them time to engage fully in the content, there was a low percentage (only 1% for web clients) that opened and then immediately trashed our emails (making me sleep a little easier at night). However, one could argue that there were so little glances because it is much easier to delete an email without opening it on webmail, but we will get to client interfaces in a minute!
Webmail reigns victorious.
With a 97% read rate on web clients, it is safe to say our audience ♥’s web clients. The uptick in webmail read rates could be due to web clients like Gmail displaying images by default. Before Gmail implemented this change, certain opens were not being tracked if a subscriber read the email, but did not take the extra step of downloading images. Now that Gmail automatically displays images, we can see those invisible opens we were never able to track before! This will lead to more opens being tracked and in turn, more eyeballs to affect the read rate.
Gmail’s promotional tab could affect the read rate too. These users are taking the time to navigate away from their primary tab where only their nearest and dearest (read: not email marketers) can reach them, and are seeking out their promotions tab to see what kind of marketing material is coming their way. This leads me to conclude that there are less “accidental opens” which will result in lower glance rates and higher read rates. The increase of “reads” also make sense because web clients are available on mobile devices. Whether you are on your iPad, Android or laptop, you have the ability to access web clients on the go, which is where reports like Campaign Monitor see the most action in email activity. It would come as no shock if we continue to see engagement for our emails grow in web clients, right along with mobile clients.
Consuming email on mobile devices.
It was no surprise that we had a killer read rate of 72% on mobile. Despite mobile users being the smallest percentage of our opens, they are more engaged on average than our desktop users. This is probably because we optimize for mobile through the use of media queries to control the size and positions of elements in the email, as well as text size, to create an optimal viewing experience. Whether our audience is kicking back on their couch with their laptop or reading about our latest EOA feature on their Droid, we can’t afford for our email to look funky in any inbox. Optyn reported that 75% of smartphone users delete emails they can’t read (e.g.: non-responsive emails that look like crap on a mobile device). If that doesn’t keep us on our toes to have our email look smashing in every client, I don’t know what will!
Not only did we see the lowest read rate, but we also saw the highest glance/delete rate on this platform with so many people (28% to be exact) trashing our emails. This trend of more trashes in desktop could be correlated to the different interfaces of mail clients. For example, in a desktop client like Outlook, it is harder to delete an email without opening it first. We say this because of the preview pane in Outlook that constantly displays the content of your email, causing opens to be tracked when someone is simply doing inbox maintenance. However, it is important to note that it would only count as an open if one’s client automatically downloads images. Web clients like Gmail do not utilize a preview pane so you can delete an email with ease without ever triggering an open.
Another theory for the spike in glance rates on desktop could have to do with the fact that the best time to organize your inbox (i.e. mass delete tons of marketing emails) is while you are at work on your desktop and have a mouse available. How often do you take the time to individually delete over 50+ emails while on the go? I can only speak for my own reading behaviors here, but inbox organization occurs solely at my desk. What about you?
We’ve only skimmed the surface…
In the next part of our series, we will be picking apart each campaign, piece by piece, to see what marketing strategies resonated the most with our audience and what strategies fell short. Stay tuned!
Feel free to share what metrics you track to uncover engagement and brand loyalty below!